plot
Table of Contents
Note
Spin-Scenario by default will plot figures using Gnuplot QT interface. If you wish to generate figures stored in computer, please use output_terminal before the plot function.
-- available types include qt, png, eps and tex.
output_terminal{type = "eps", font = "Arial,14"}
pulse sequence block
For sequence block, user can directly call plot function, and the corresponding figures will be generated automatically. An intuitive usage can be found in shapedRF.
void plot(sol::variadic_args va, const seq_block & /*sb*/);
lines and matrix
For general matrix or vector, same plot function can be applied.
Note
Spin-Scenario has three basic data structures for the plotting.
linefor one line.line_seriesfor multi lines.mapfor 2-D matrix.It is required that the input data type of
plotfunction should be any one of them.
2-D line plot
There are several approachs to construct a line.
line(string file); // case 1.
line(const sol::table &y); // case 2.
line(const sol::table &x, const sol::table &y); // case 3.
line(const vec &y); // case 4.
line(const vec &x, const vec &y); // case 5.
Example script to simply plot these lines is as follow:
-- create y vector.
local y ={}
for i = 1, 20 do
  y[i] = i*i
end

-- case 2.
plot(line(y))

-- create x vector.
local x ={}
for i = 1, 20 do
  x[i] = i/2
end

-- case 3.
plot(line(x, y))

-- case 4.
local vy = table2vec(y)
plot(line(vy))

-- case 5.
local vx = table2vec(x)
plot(line(vx, vy))

-- case 1.
write("vector.txt", vy)
plot(line("vector.txt"))
To make the figures more flexible, additional args of figures can be specified.
plot("args1", line( , "args2"))Note
args1is related to the figure’s properties, e.g. title, labels, legend, line width, etc. A fullargs1can be written astitle<xx> xlabel<xx> ylabel<xx> legend<xx> xrange<1:10> yrange<2:50> lw<2> gnuplot<xxx>. The last onegnuplotis an useful interface for using Gnuplot commands.
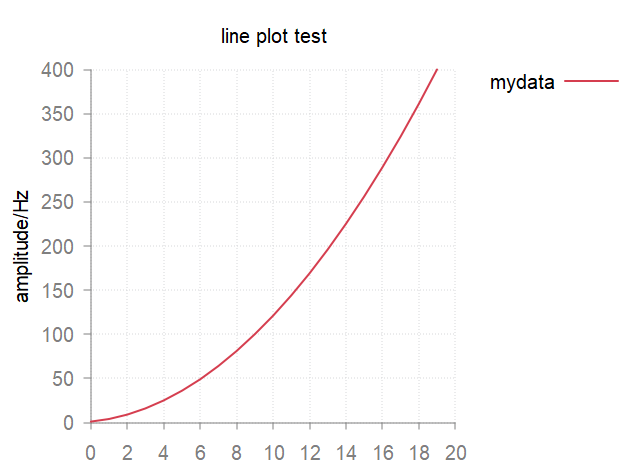
- A simple example:
plot("title<line plot test> ylabel<amplitude/Hz> legend<mydata> gnuplot<set key outside>", line(y))
- This will plot a figure like this.
Note
args2is related to the line’s properties, e.g. style, marker, color, dash, etc.args2can be written as “val1 val2 val3”.
- Another example:
plot("title<line plot test> xlabel<time/s> ylabel<amplitude/Hz> legend<mydata> gnuplot<set key outside>", line(x,y,"k lp *"))
- This will plot a figure like this.
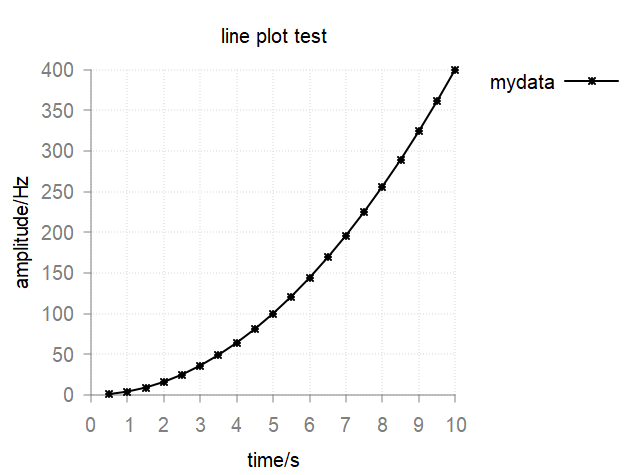
Available options for args2 can be found in line-properties.
Multi lines plot
Based on the above single line plot, it is quite straight forward to plot multi lines in one figure: just add the additional lines to the end.
plot("args1", line( , "args2a"), line( , "args2b"), line( , "args2c"))
A example:
local y2 ={}
for i = 1, 20 do
  y2[i] = (20-i)^2
end

plot("title<line plot test> xlabel<time/s> ylabel<amplitude/Hz> legend<mydata> gnuplot<set key center top>", line(x,y,"k lp *"), line(x,y2,"r lp +"))
- This will plot a figure like this.
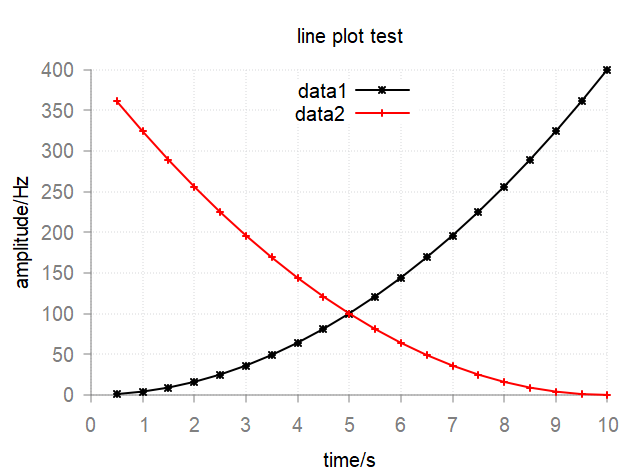
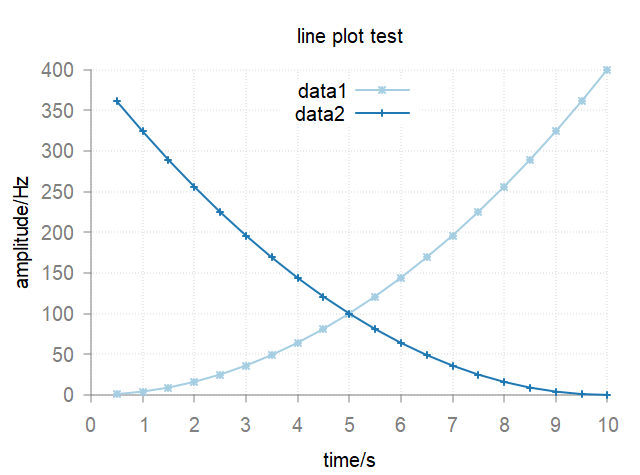
If user does not specify the colors for lines, the plot function will automatically assign them according the default color schemes in gnuplot-colorbrewer. You may add e.g. color<Paired> to args1 to choose different color scheme.
plot("title<line plot test> xlabel<time/s> ylabel<amplitude/Hz> legend<data1;data2> gnuplot<set key center top> color<Paired>", line(x,y,"lp *"), line(x,y2,"lp +"))
2-D matrix plot
There are two approachs to construct a matrix (map).
map(string file); // case 1.
map(const mat &m); // case 2.
The usage of plot function is similar to that of line. You can use plot("args1", map( , "args3")).
Note
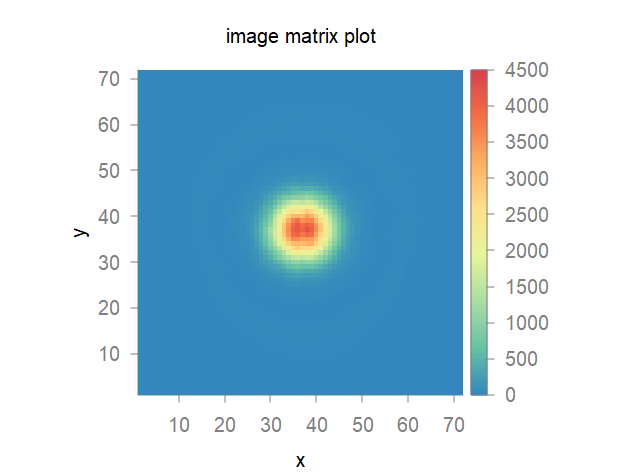
“args1” is also the figure’s properties. args3 is related to the map’s properties, e.g. style<image> or style<3d>. If args3 is empty, 2d image style will be used.
plot("title<image matrix plot> xlabel<x> ylabel<y> color<Spectral> gnuplot<set palette negative\n set size ratio -1>", map("raw_abs.txt"))
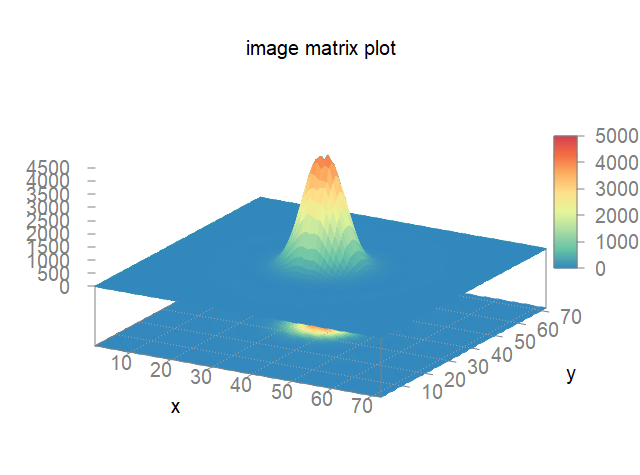
plot("title<image matrix plot> xlabel<x> ylabel<y> color<Spectral> gnuplot<set palette negative\n set size ratio -1\n set cbtics 1000>", map("raw_abs.txt", "style<3d>"))
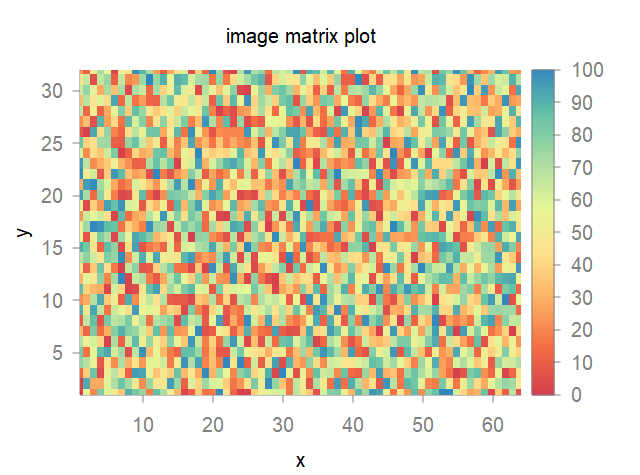
It is also possible to plot a matrix data from Lua table.
local usr_table ={}
local nrows, ncols = 32, 64
for i = 1, nrows do
  for j = 1, ncols do
  usr_table[(i-1)*ncols+j] =  math.random(100)
  end
end

local m = table2mat(usr_table, nrows, ncols)

plot("title<image matrix plot> xlabel<x> ylabel<y> color<PiYG>", map(m))